Building Databoards
📊 Databoards are interactive dashboards. Combine multiple query visualizations, filters, titles, and images on a drag-and-drop canvas.
📍 Accessing Databoards
BI → Databoards (/app/avantbi/databoards)
- Add databoard — blank canvas.
- Click a databoard card — open the editor.
- Home lists your four most recently updated databoards.
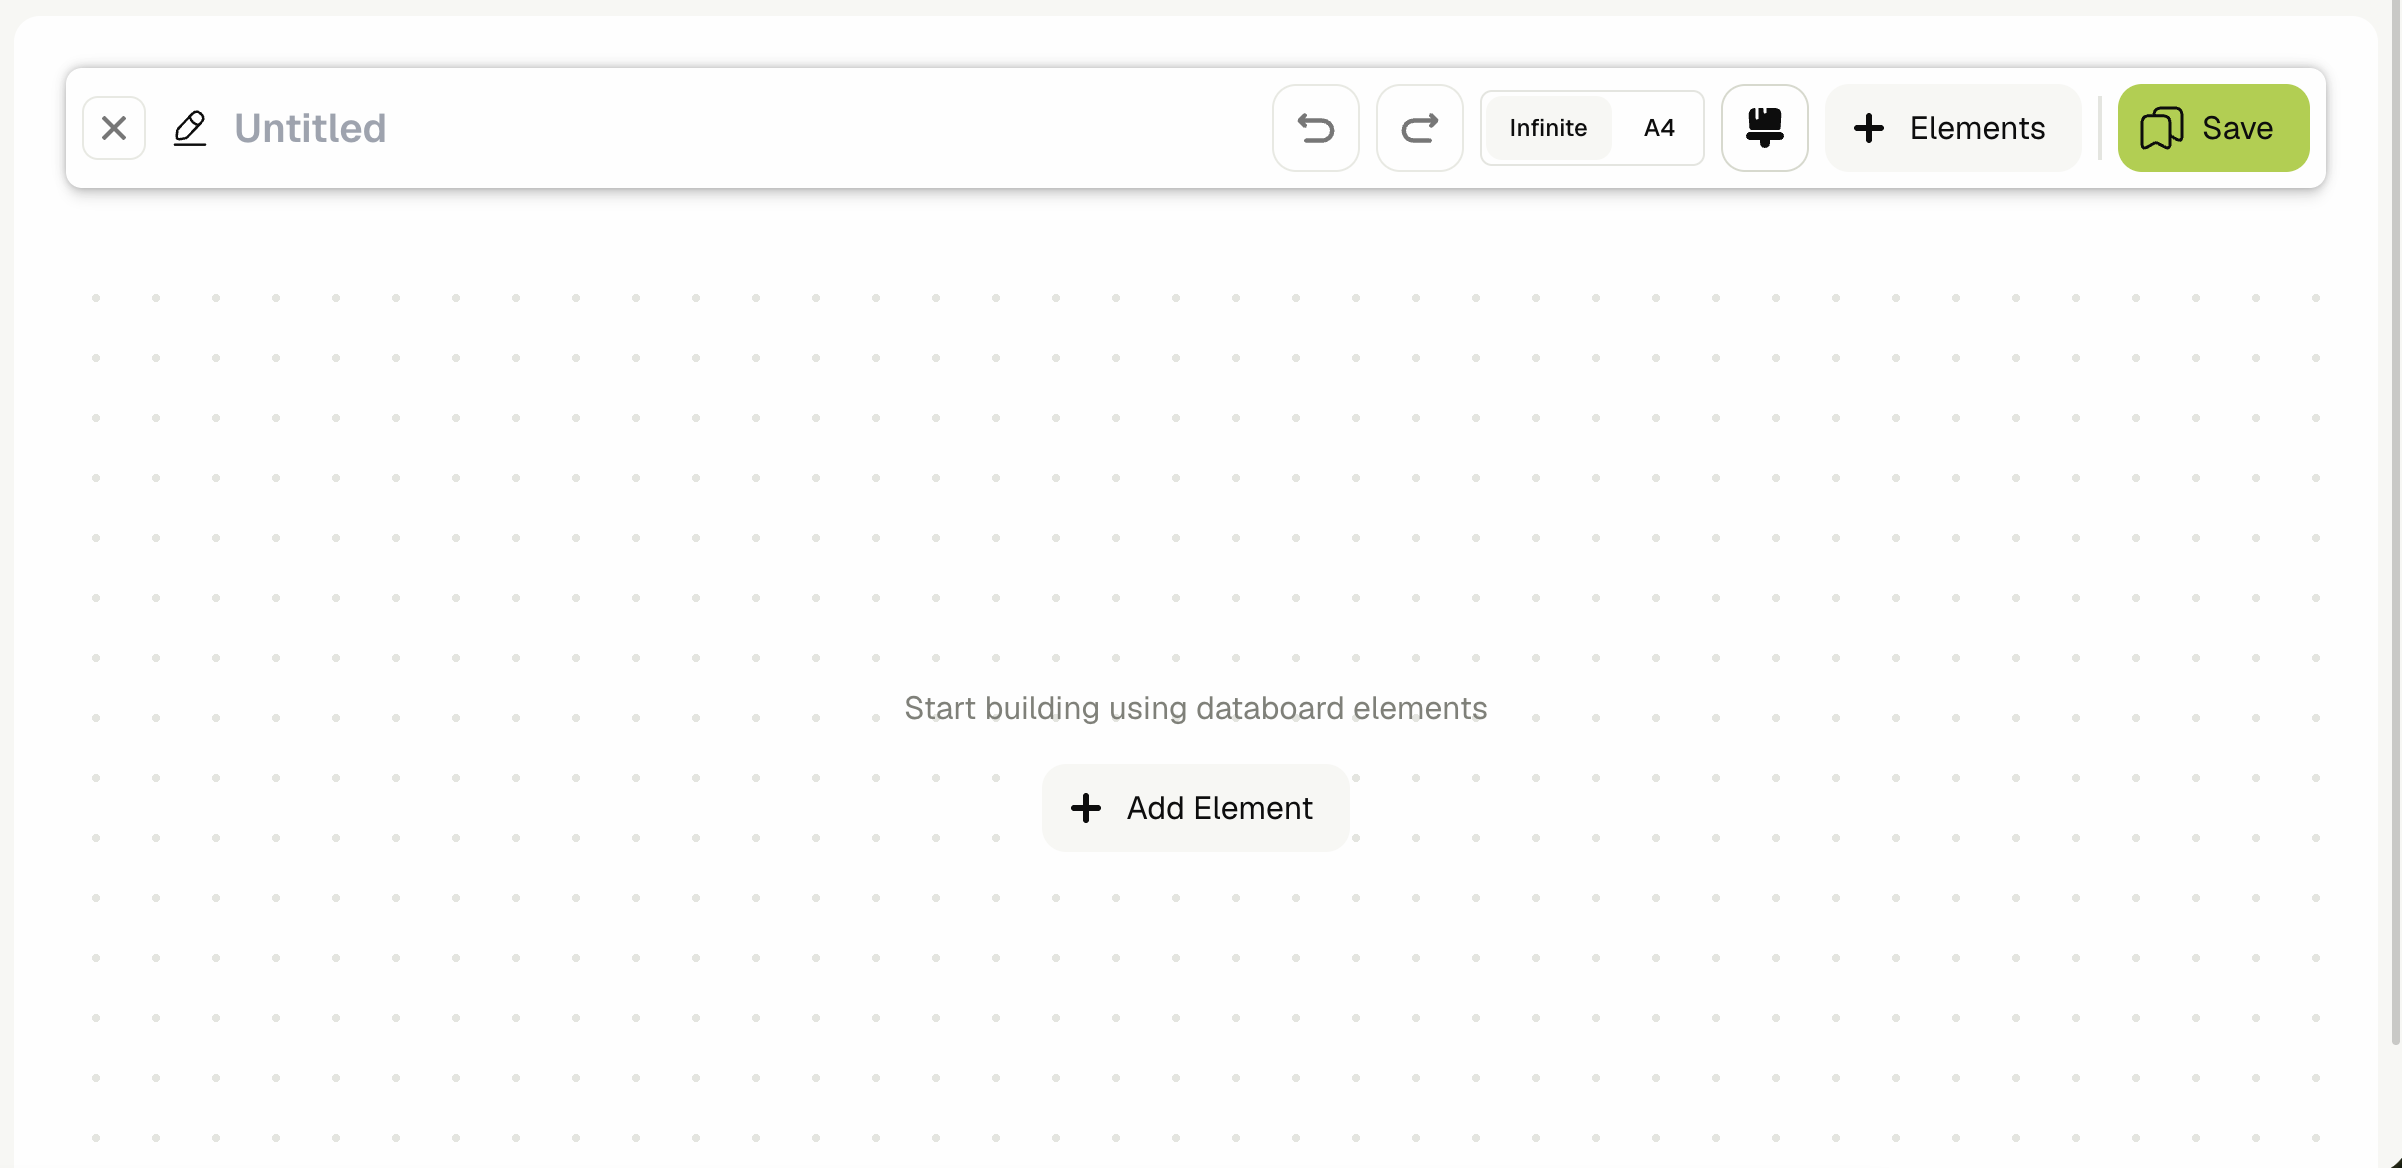
➕ Creating a databoard
- Click Add databoard.
- Enter a title (and optional description from the list view).
- Use Add element to insert:
- Query — pick an existing saved query.
- Parameter — shared filter control.
- Title — section heading.
- Spacer — layout spacing.
- Image — upload or link an image.
- Drag and resize elements on the grid canvas.
- Save the databoard.
⚙️ Canvas tools
| Feature | Description |
|---|---|
| Drag & resize | Grid-based layout; elements snap to columns |
| Undo / redo | Revert layout and configuration changes |
| Query picker | Attach or swap the query behind a query element |
| Parameter linking | Connect parameter elements to query parameters |
| Branding | Custom palette themes, typography preset, surface mode |
| A4 preview | Page guides for PDF-friendly layouts (important before PDF shares) |
| Access controls | Restrict which users/roles see the databoard (see Roles & access) |
| AI briefing | Auto-generated natural-language summary of the board (configurable prompt) |
| Dashboard targets | Pin the databoard to the ERP home dashboard |
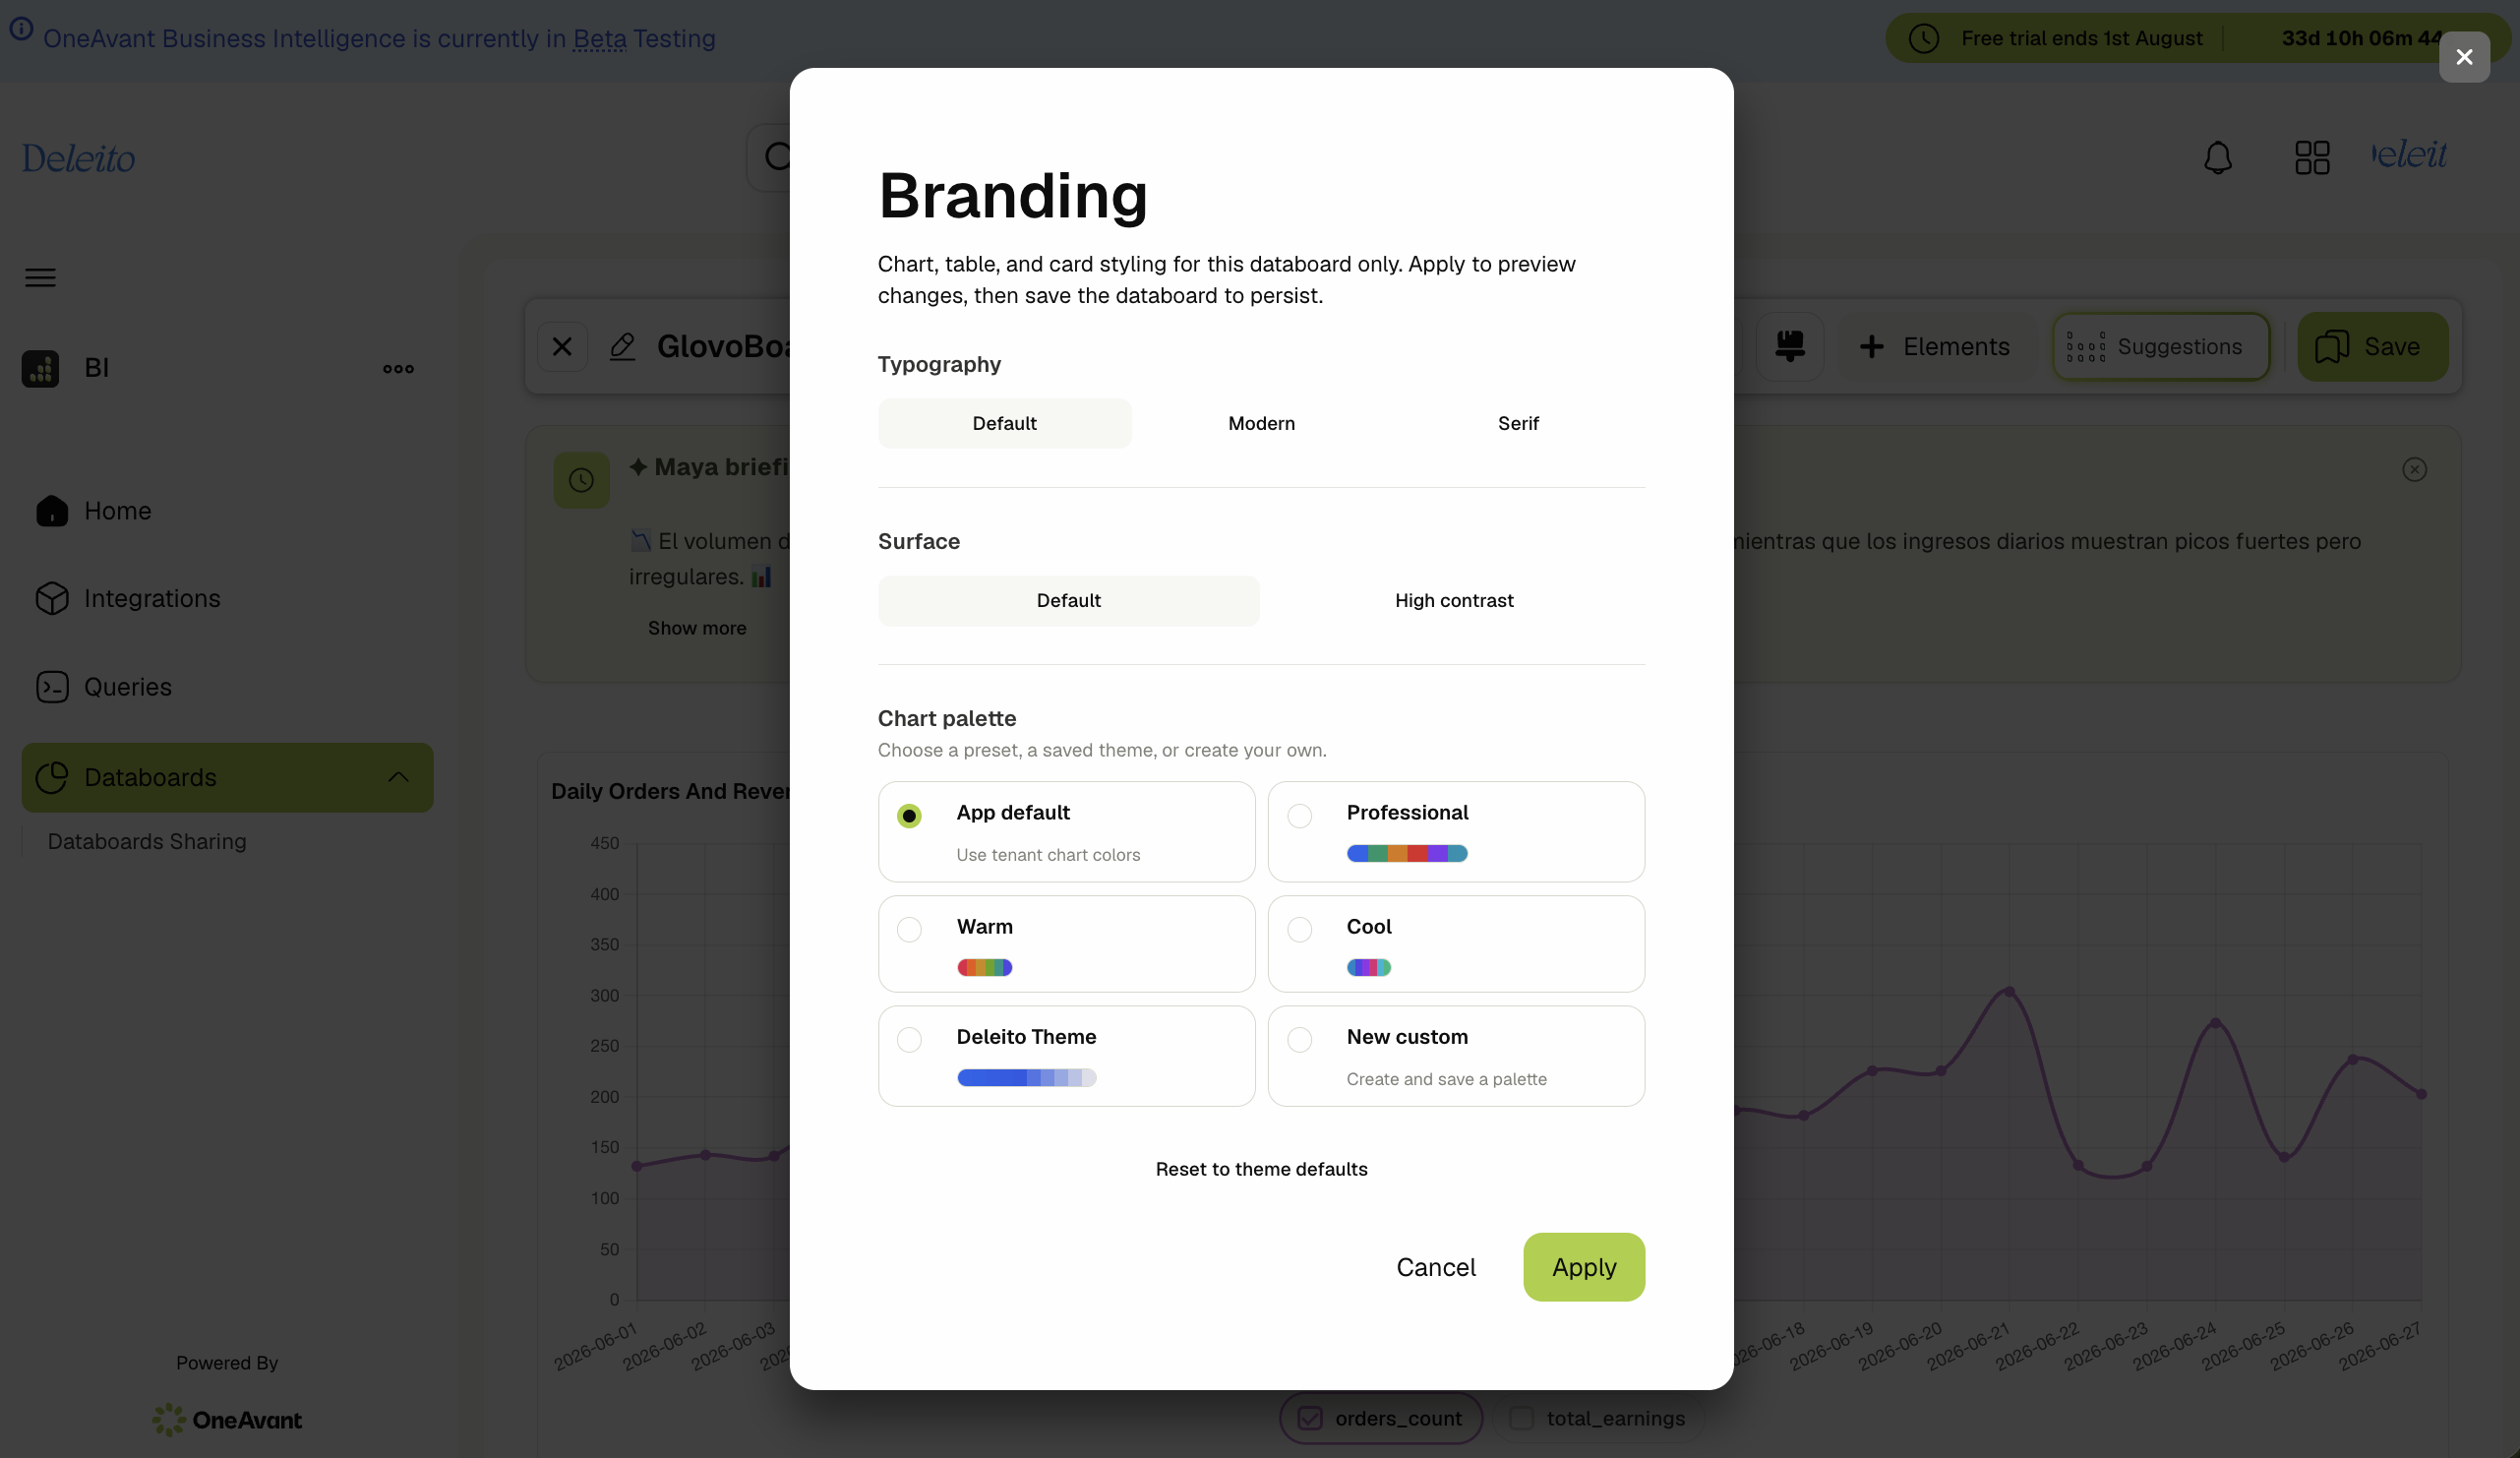
⚙️ Branding
Open Branding from the databoard editor:
- Choose a palette theme (Professional, Warm, Cool) or define custom anchor colors.
- Set typography preset (Default, Modern, Serif).
- Toggle surface mode (Default vs Contrast background).
Branding applies to charts and tables on that databoard.
⚙️ AI briefing
Enable AI briefing on a databoard to show an auto-generated summary when viewing the board.
- Toggle on/off per databoard.
- Optionally set a custom prompt to steer what the summary emphasizes.
Requires Maya / AI capacity on the tenant.
⚙️ ERP dashboard embedding
From the databoard list or editor, open Dashboard targets and enable ERP.
The databoard then appears in the ERP (Logstock) dashboard for users who can access it.
![]()
⚙️ View mode vs edit mode
- Edit mode — full toolbar, drag handles, element configuration.
- View mode — read-only presentation; parameters remain interactive.
Shared links open in view mode (with token-based access when shared externally).
🚫 Scope notes
- Query elements always reference saved queries — edit the underlying query from the query editor or via the element’s edit action.
- Large databoards with many heavy queries may load slowly; consider parameters to limit data volume.
- PDF shares render the databoard as viewed in the browser — use A4 preview before scheduling PDF delivery.