Queries
📝 Queries are saved SQL reports. Each query belongs to a data source, can accept parameters for filtering, and renders as a table or chart visualization.
📍 Accessing Queries
BI → Queries (/app/avantbi/queries)
- Add query — create from scratch.
- Click a query card or row — open the editor.
- Home shows your four most recently updated queries.
📋 Viewing queries
The queries list supports:
- Card and table views.
- Search, sort, and filters (including filter by data source).
- Source badge showing which integration or database the query uses.
➕ Creating a query
- Click Add query.
- Select a data source (integration or database connection).
- Write SQL in the editor. BI uses
:parameterNameplaceholders for dynamic values. - Click Run (or equivalent execute action) to preview results.
- Configure the visualization (chart/table type, axes, aggregations).
- Save with a title.
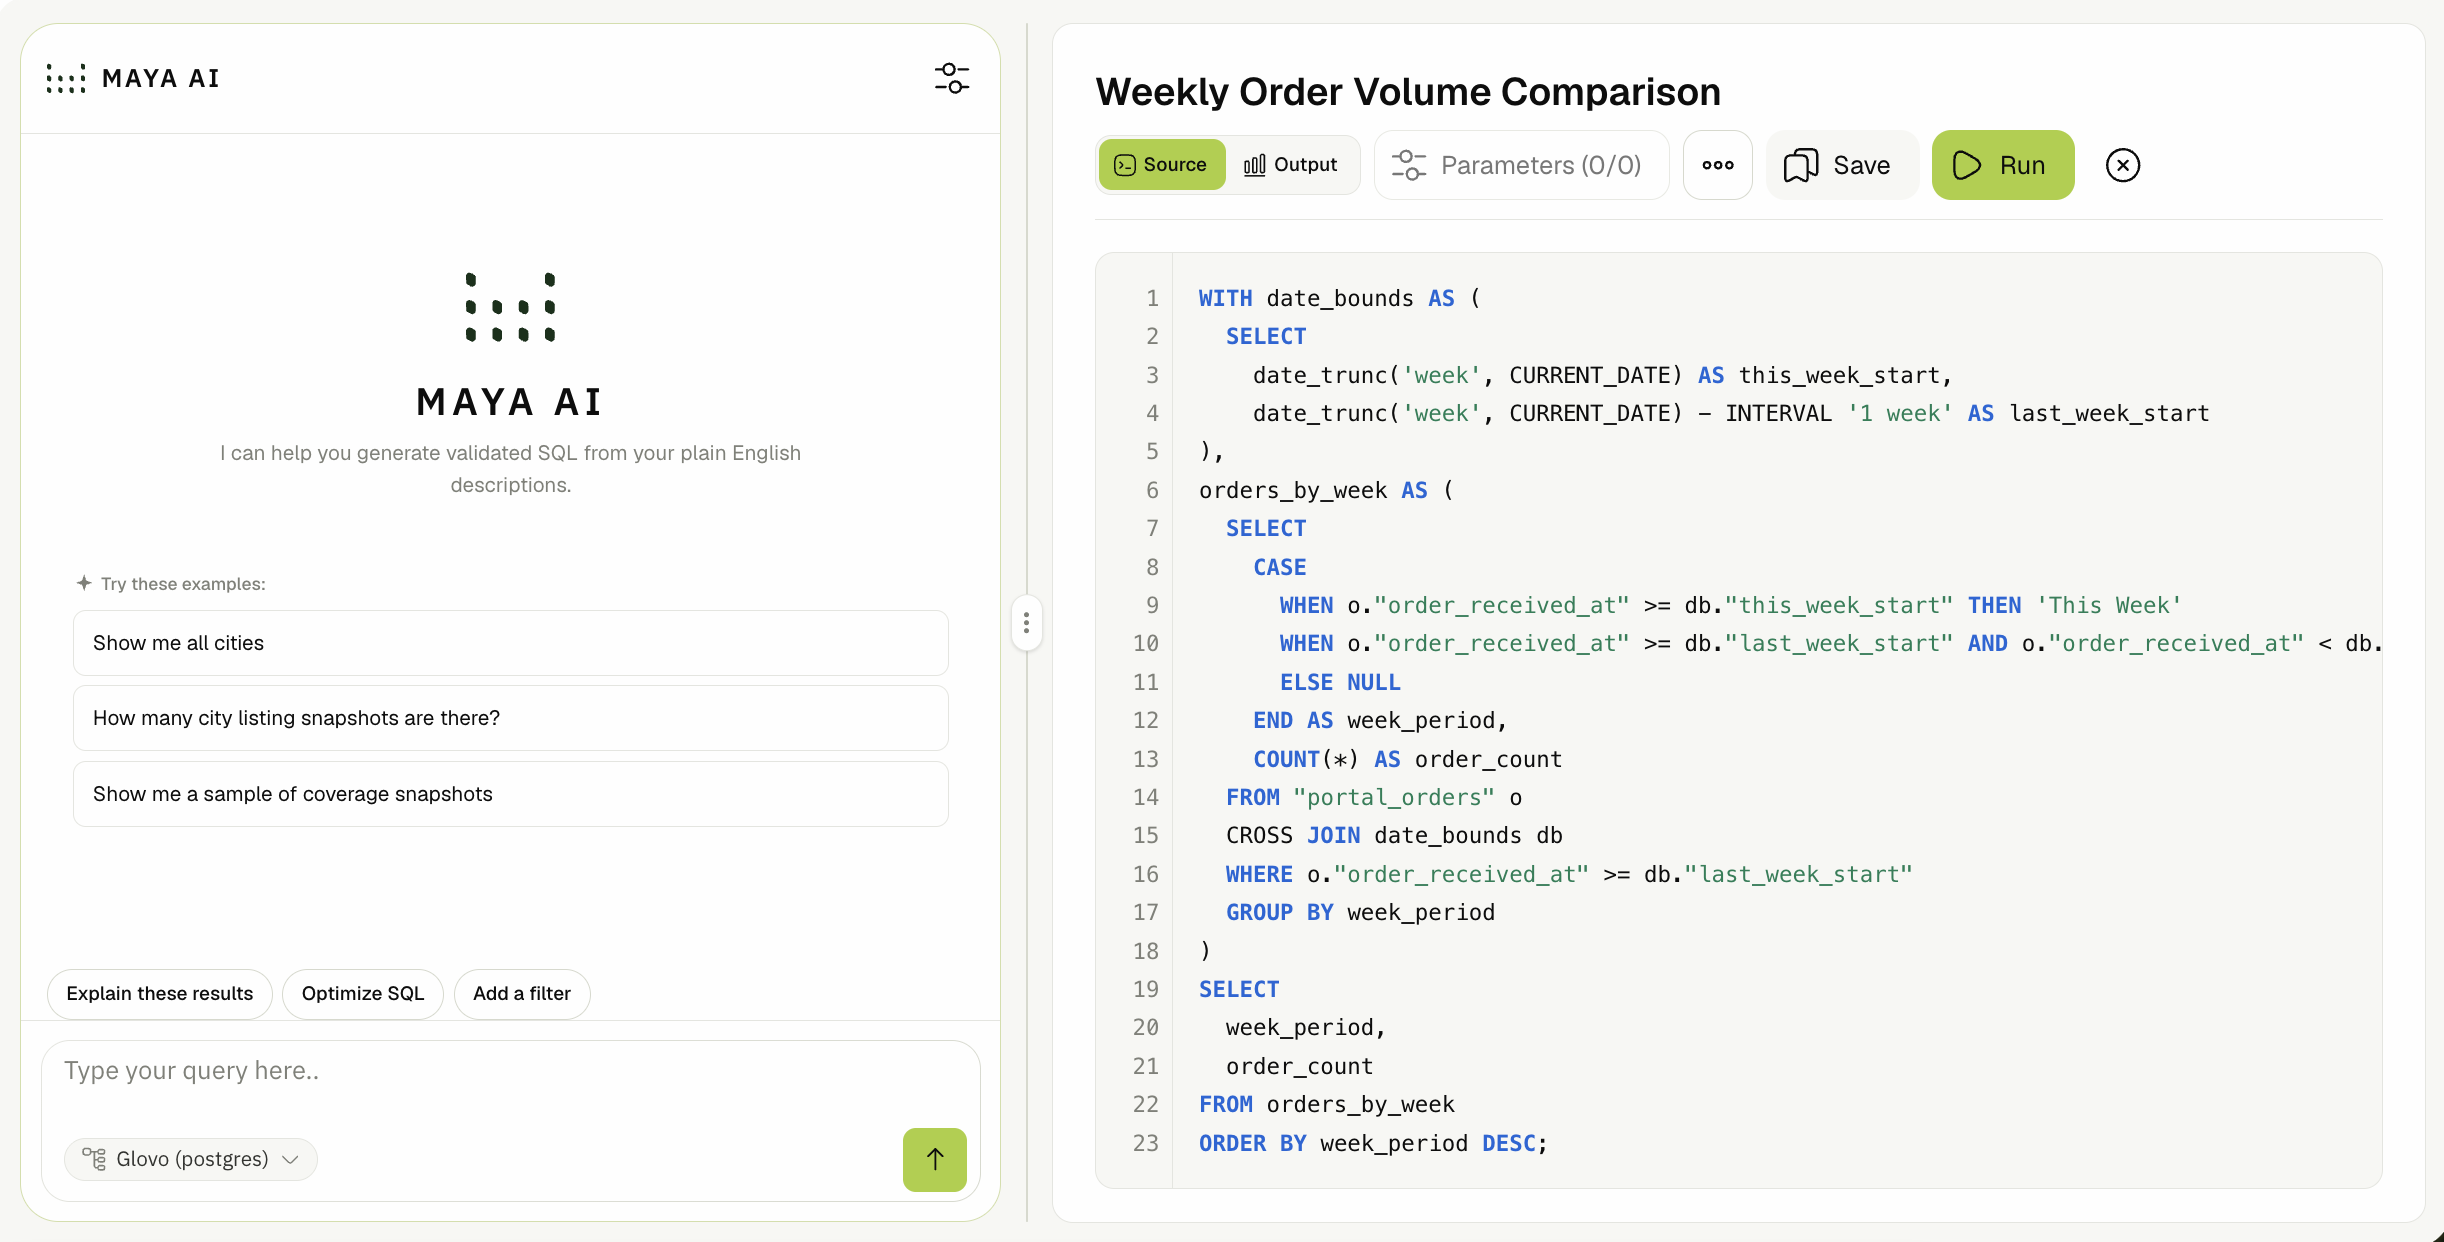
With Maya AI (recommended)
When the Maya module is enabled, the query editor opens with Maya chat beside the SQL canvas:
- Describe what you need in plain English; Maya generates validated SQL.
- Pick the target data source in the chat so Maya knows which schema to use.
- Review suggested SQL in a diff dialog before applying.
- If execution fails, use debug to send the error back to Maya for a fix.
Open the SQL canvas with Open editor if you collapsed it to focus on chat.
⚙️ Query parameters
Add parameters to make queries reusable:
| Type | Example use |
|---|---|
string | Store name, SKU |
number | Minimum quantity |
boolean | Include inactive rows |
date | Reporting period start/end |
Value sources:
- Static — fixed dropdown options you define.
- Query-driven — options loaded from another query (label + value columns).
Parameters appear in the toolbar when running the query and can be linked to databoard parameter elements.
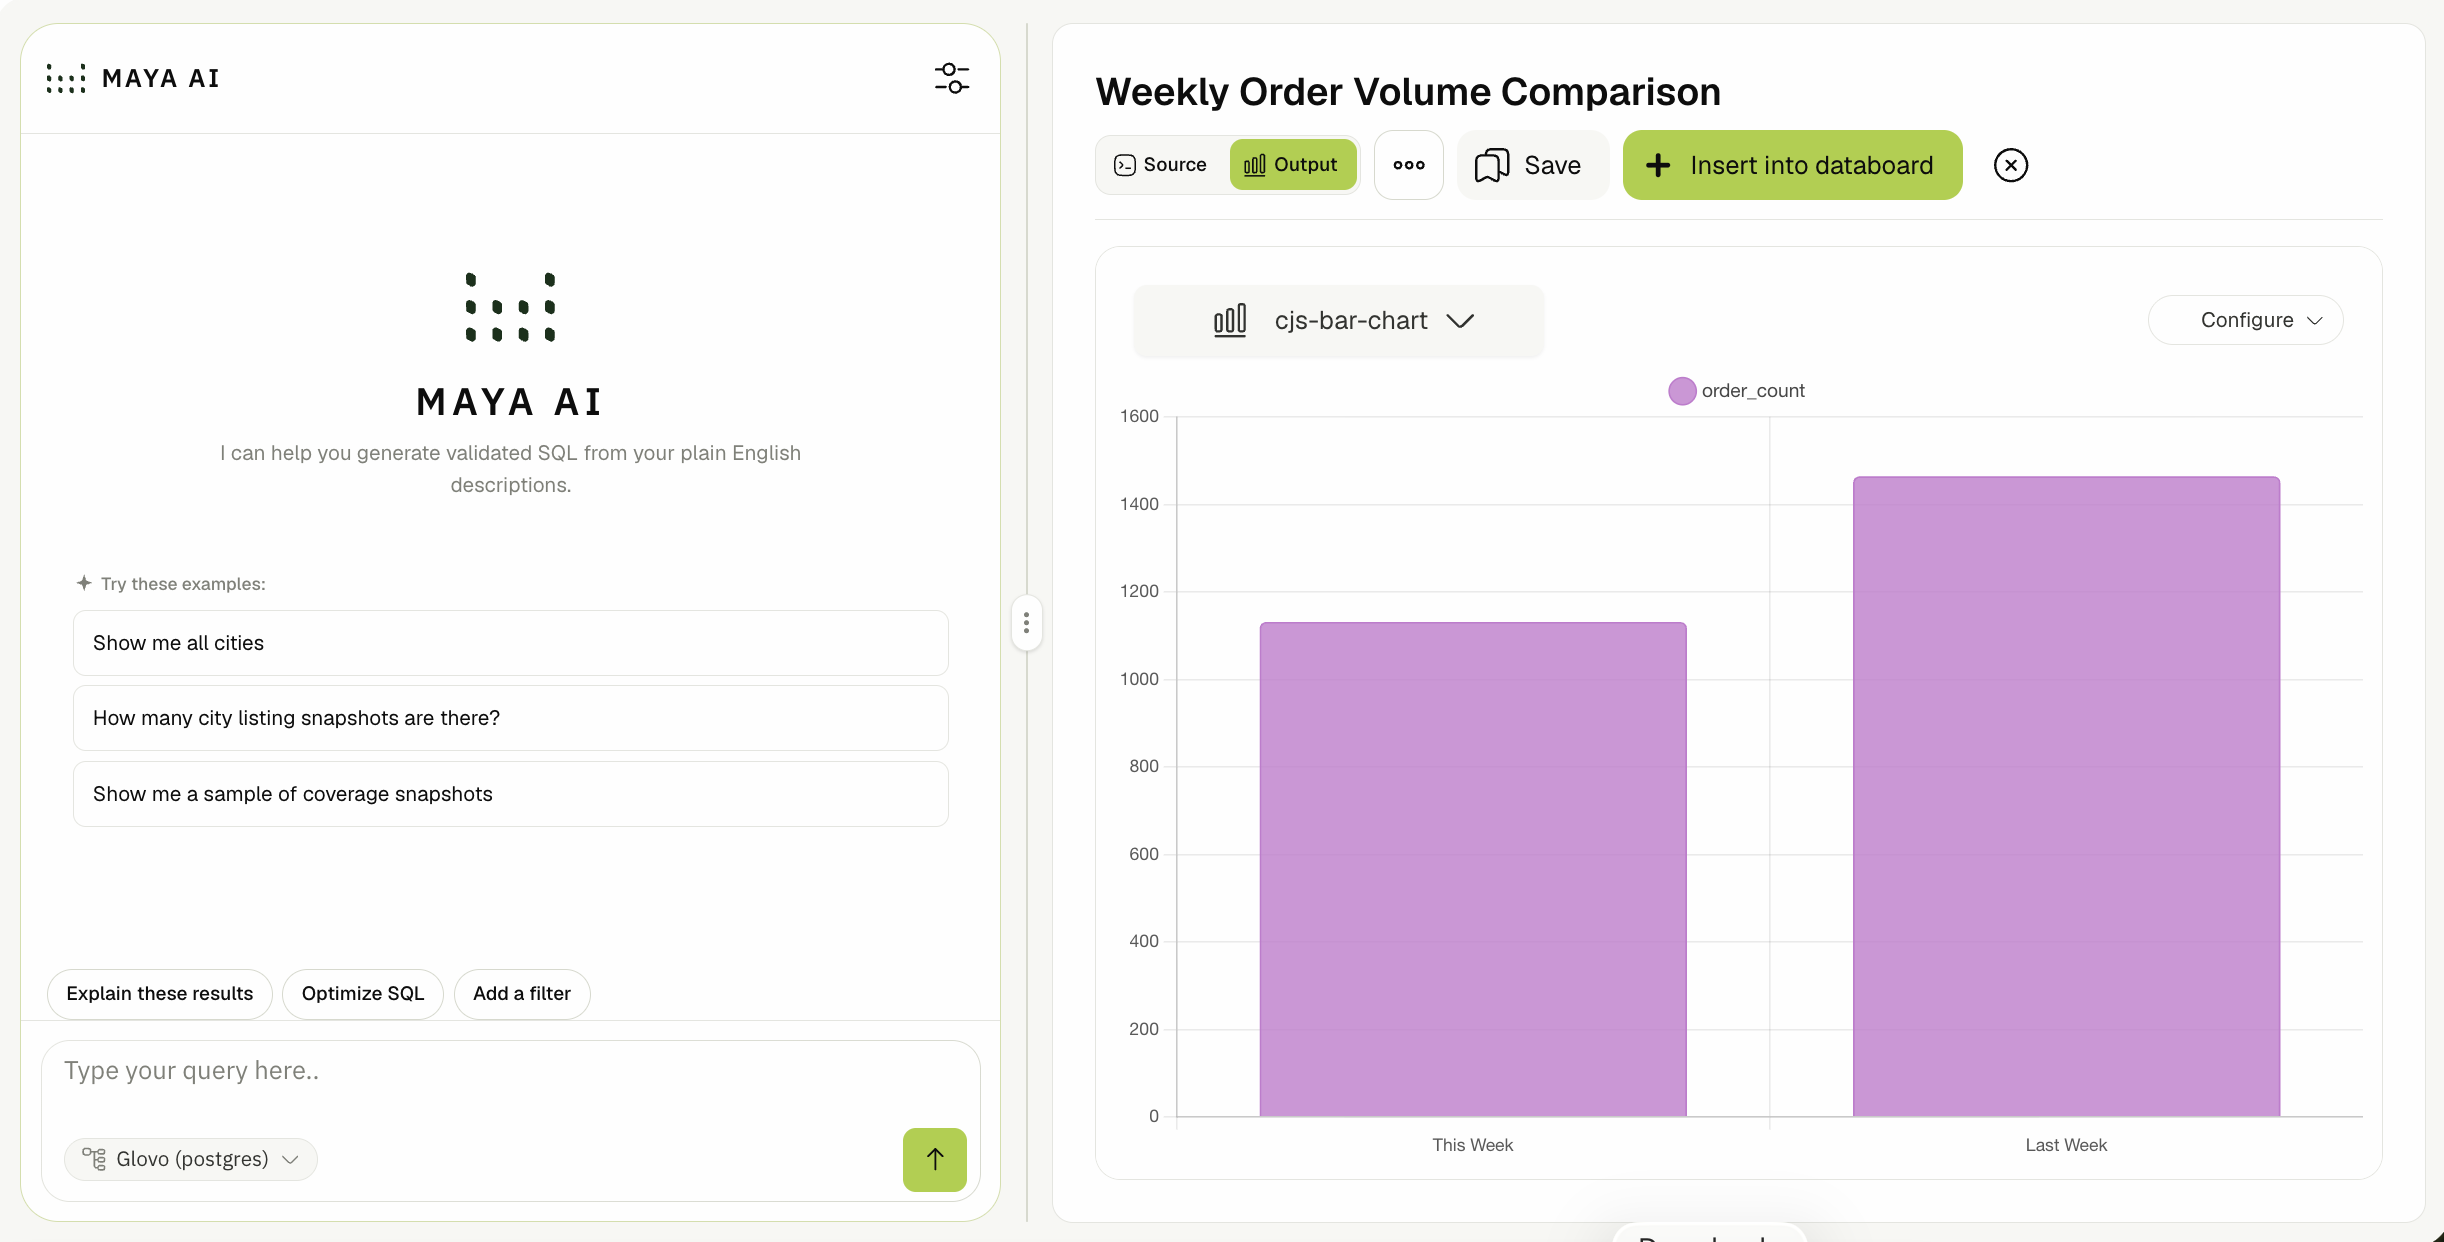
⚙️ Visualizations
After SQL runs successfully, choose how results display. See Databoard visualizations for the full chart/table catalog.
Common choices at query level:
- Table / Paginated table — raw rows.
- BI table — grouping, subtotals, conditional formatting.
- Card — single KPI (value + optional comparison).
- Chart.js charts — bar, line, pie, doughnut, scatter, combo, etc.
Export result data to CSV where the export action is available in the editor toolbar.
⚙️ Insert into databoard
From a saved query, use Insert into databoard to add the query as a widget on an existing databoard (or create a new one).
🚫 Scope notes
- SQL dialect depends on the data source (StarRocks/warehouse SQL for ETL integrations; native dialect for direct DB connections).
- Unsaved changes trigger a navigation guard when leaving the editor.
- Maya AI requires the Maya module on your tenant and consumes AI token quota per your subscription.