Alerts
🚨 Alerts in the IoT Server Dashboard surface live faults across integrations, devices, and entities so you can react before guests notice. Use this page to triage what is currently broken, mute noisy causes during scheduled work, and review recently cleared issues.
📍 Accessing Alerts
This page requires an account with the Admin or Engineer management role.
- Log in to the IoT Server Dashboard with your management credentials.
- Click Alerts in the left sidebar to open the alerts page.
📋 Viewing Alerts
The page shows one row per active fault that the IoT monitor has detected. Rows refresh in real time over a live connection, so newly raised, updated, or cleared alerts appear without a manual reload.
The table includes the following columns:
-
Alert — Human-readable title that names the integration, device, or entity at fault.
-
Severity — One of warning, error, or critical. Colored chips help spot the most urgent rows at a glance.
-
Status — Active while the underlying issue is still detected, or Cleared for resolved rows shown when Show cleared is on.
-
Type — The fault category. See Understanding Alert Types for the full list.
-
Affected — Roll-up summary of impacted controls, devices, and entities (for example,
3 controls, 5 entities). Use this to gauge the blast radius before you act. -
Mute — Shows the remaining mute window for muted rows (for example,
45m left,Forever) or—when the alert is not muted. -
Started — The timestamp when the alert first fired.
Only devices and entities linked to a dashboard control are monitored. Devices and entities that no integration consumer has wired up never produce alerts on their own.
🔍 Searching, Filtering, and Visibility
- Enter text in Search alert to narrow the list to titles that match.
- Open the Severity filter to limit the list to critical, error, or warning rows.
- Open the Type filter to limit the list to specific fault categories.
- Click Clear filters to reset all selected filters.
- Toggle Show muted on to include rows whose cause is currently muted. The default view hides them so you only see actionable alerts.
- Toggle Show cleared on to merge recently cleared alerts from history into the list. Cleared rows are read-only and appear with the Cleared status badge.
Your Show muted and Show cleared choices are stored in the URL, so you can bookmark or share a filtered view.
🔔 Understanding Alert Types
The monitor consolidates faults so a single upstream failure does not produce a flood of child alerts. Rules apply in order — when an upper rule fires, the lower rules under the same scope are folded into its Affected roll-up instead of emitting their own rows.
| Type | Severity | Triggered When |
|---|---|---|
| integration.errored | critical | An integration is in the error state. Suppresses all device and entity alerts under that integration. |
| integration.stopped | error | An enabled integration is stopped and no longer reporting. Suppresses all device and entity alerts under that integration. |
| integration.start_failed | error | An integration could not start during initialization. |
| device.not_present | error | A monitored device is no longer reported by its integration. Suppresses entity alerts on that device. |
| device.unavailable | error | A monitored device is reported but is not available for commands. Suppresses entity alerts on that device. |
| entity.not_present | error | A monitored entity is no longer reported by its integration. |
| entity.unavailable | error | A monitored entity is reported but is not available for commands. |
| device.battery_critical | error | A monitored device reports a battery below the critical threshold (15%). |
| device.battery_low | warning | A monitored device reports a battery below the low threshold (30%) or its integration flags it as low. |
Alerts clear automatically the moment the underlying state recovers — there is no manual confirmation step for normal recoveries. The Clear action is for manually retiring a row when you know the cause is gone.
⚙️ Clearing an Alert
Use Clear when you want to retire an active row from the list. The row is closed and the alert disappears for everyone.
- Locate the active alert row in the table.
- Click the Clear icon button in the row actions.
- Read the confirmation prompt and click Clear to confirm, or Cancel to keep the alert.
If the underlying issue still exists the alert will reappear shortly on the next monitor sweep. Use Mute instead of Clear when you need to silence a known problem.
🔕 Muting an Alert
Use Mute to keep an alert in the database for history but hide it from the active view while you work on a fix or wait out a scheduled outage. Muting is keyed by cause, so the same fault will stay muted even if it briefly clears and re-fires.
- Locate the active alert row in the table.
- Click the Mute icon button in the row actions.
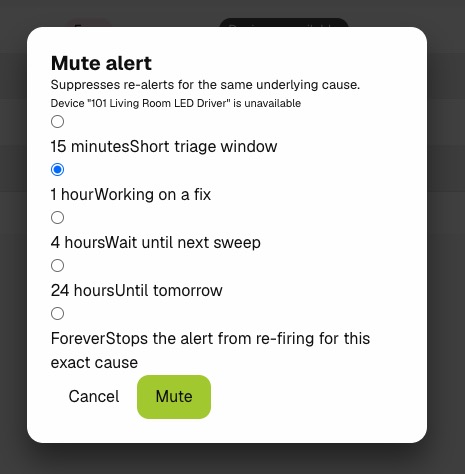
- Select a duration in the Mute Alert dialog:
- 15 minutes — Short triage window.
- 1 hour — Working on a fix.
- 4 hours — Wait until the next sweep.
- 24 hours — Until tomorrow.
- Forever — Stops the alert from re-firing for this exact cause.
- Click Confirm to apply the mute, or Cancel to keep the alert active.
The row's Mute column updates with the remaining window (for example, 1h left) and the alert is hidden from the default view until the mute expires.
Muted alerts continue to be recorded. Toggle Show muted on to see them, and use Unmute to bring an alert back into the active view immediately.
🔊 Unmuting an Alert
- Toggle Show muted on so muted rows appear in the list.
- Locate the muted alert row.
- Click the Unmute icon button in the row actions.
The mute is removed and the row returns to the default active view.
Related Docs
- Integrations — Manage the integrations whose status drives
integration.*alerts. - Devices & Entities — Review the devices and entities that produce
device.*andentity.*alerts. - Controls — Link entities to controls so they become monitored and surface in alerts.
- Activity Logs — Audit clear, mute, and unmute actions taken from this page.